
Wednesday, July 31, 2019
Day 18
Today in the morning meeting Joe showed us some of the past interns presentations and gave us the link so we could look at them all for help with our presentations that we have been working on. After we went down to the second floor to see the room that we would be presenting in and see the size of the screen our presentation would be on to get a understanding of how big things need to be on each slide. After the meeting me and my lab partner went to our lab and began editing our slides so some of our pictures and graphs could be seen better and so it looked more appealing to the audiences eyes. After a while of work on this me and my lab partner took the data we gathered from the manual image analysis pictures that we already completed and began to transpose them
 from pixels to microns. After we did that our advisor said that we should make histograms to go with the data in each chart but we ran into some trouble. Instead of the chart giving us the grain size distribution for each sieve it gave us the cumulative distribution for the whole thing. When this happened it took us a while to try and figure out what was wrong and by the end of the day this was still an issue we needed to fix tomorrow.
Tuesday, July 30, 2019
Day 17
Today during our morning meeting we went over my outline for my presentation because I wasn't here yesterday when the rest of the group went over there's. After we went over the outline and the meeting was finished me and my lab partner went back to our lab and began working on our presentation and outline based on the critics we got from the morning meeting. After we looked at the presentation and did a couple things, I worked on so ImageJ analysis for the sand and clay. After I finished the one for sand, me and my lab partner began working on 2 dry sieving experiments for the gravel. We finished all the dry sieving trials officially now. After we finished these trials we went to work creating the graphs for each of the trials as well as calculating the data for each trial. After this I spent some time working on the presentation, by inserting the graph and data from each of the trial. Once I finished that I worked most of the rest of the afternoon on the manual image analysis of sand that I had be working on the past Friday.


Friday, July 26, 2019
Day 15
At the staff meeting this morning, Joe had one of the senior students from the Center of Imaging Science come in a present to us his senior project. He talked manly about OCR's which stands for Optical Character Recognition. Once I went back to my lab I worked on some of the presentation in our powerpoint. After that I spent most of the rest of the day working on the manual image analysis for my sand samples under the microscope.


Thursday, July 25, 2019
Day 14
Today for our morning meeting we went to the drone lab to see what types of things they do an after that we were taken up on the roof of the building that we do all of our work in to see the view. After the meeting me and my lab partner starting working in our lab. We started the first trial with the gravel but soon realized that for the gravel we needed to change the sieve sizes we use for the gravel. We need a wider distribution of the larger sieves rather than the smaller ones. This is because most of our sample stayed in the top sieve of the stack of them. As shown in the chart below:


We weren't gonna change the sieves for all 3 samples but in this case we don't have a way around this and if we want a better distribution we have to change the sizes for the gravel sample. After we finished this trial and calculated the percentages we came back down to our lab and started to figure out what sieve sizes we should use. We decided that we were gonna do the other 2 trials tomorrow and instead continue working on the manual image analysis we had to get down for both the sand and also the clay & silt combination. For most of the rest of the day we worked on taking the images from the camera and the microscope and did the manual image analysis on the ones we could as of now. We decided to do this most of the day because it takes a long time to to this analysis.
Day 13
Today we went to the last interns lab during the morning meeting. once the morning meeting was finished Joe, our advisor, wanted to meet with us to talk about our outline that I sent him the day prior to look over for us. He said that overall it was good and wanted to look at the graphs I had made for the sand. He told me that they were good but I should shorten my graphs a bit because the data was basically finished after a certain number sieve. After the meeting with Joe me and my lab partner went to our lab and started 2 rounds of sieving the clay and silt sample.
After we completed these 2 trials we came back down to the lab and began calculating the percentage and cumulative percentage weights for each of the trials. After all that math was calculated I began working on the 6 graphs I have to make/ re-do for the analysis part of the presentation. Once I finished making those graphs i put them into the presentation. After I worked on the presentation for a bit I began working on the manual image analysis for the sand sample for dry sieving because that was gonna take a while.
 |
| Trial #2 |
 |
| Trial #3 |
Tuesday, July 23, 2019
Day 12
Today at our morning staff meeting we went to another interns lab. She talked about using python to classify 3 different types of leaves. One kind that was healthy and two kinds that were diseased. After the morning meeting me and my lab partner came back to our lab and began running our first test for the clay and silt sample. When we first ran the complete trial with the clay and silt we saw the difference in the two soil types almost immediately. With the sand we had no sample within the first 7 sieves but with the clay and silt we did. After we finished that trial we calculate all the percentages and I made the graph for that trial. After the trial was done we started working on more of our presentation. For the rest of the day i spent it working on imageJ doing some image analysis and i worked on the presentation and also redid some of the graphs because 2 of them were different from the rest.
 |
| Sand Trial |
 |
| Clay and Silt Trial |
Monday, July 22, 2019
Day 11
This morning we had no staff meeting because our advisor was going to be in late. So when I got here I went straight to my lab room and began working on the presentation and outline again. Once my lab partner got there we began working on our 3rd and final trial for the sand sample. After we finished the trial and all the calculations me and my lab partner finished the outline and asked our advisor Chris to go over it and make sure it was good. After lunch and for the rest of the day i worked on the presentation and making graphs for each of the charts of data. For example this was our first trial and the graph that goes with it.


Friday, July 19, 2019
Day 10
Today we went to another interns lab during our morning meeting. After the morning meeting me and my lab partner went back to our lab and began working on our 2nd trial for dry sieving with sand. After we did our sieving we came back to our lab and began calculating the percentages needed in our chart (below).

 blinding white light. The next day around 4:30 am the earths atmosphere erupted in bright red and green colors. When you can see the northern lights you know that a sun storm took place. These sun storms can cause major power outages, like the one on New Years Eve of 1999. A sun storm looks like this on the sun.


After we completed this trial and did all of our calculations we went to a seminar. In this seminar we learned about a early warning system for space weather storms. Professor Rodger Dube talked in this seminar. When talking about these storms Professor Dube brought up the history of the first ever space storm in September 1859. This storm was discovered by a British Solar Astronomer, Richard Carrington. Mr. Carrington witnessed on September 1st, 1859 at 11:18am, a enormous group of sunspots, followed by a


After the seminar me and my lab partner came back to my lab room and calculated the percentages for the first trial we did in the morning. In the afternoon we worked on our presentations for the last day and also our outline that is due the 29th.
Thursday, July 18, 2019
Day 9
Today we started off with our morning meeting by going to my lab to explain what the GRIT machine is, that was explained in a prior blog. After the presentation was done me and my lab partner got started on working on our official experiments for dry sieving. We still have to wait to do our wet sieving because we are waiting for parts to be shipped. We started off by using a 200 gram soil sample of sand with our first experiment. We had a couple problems with that small of a sample size after we were sorting out the grains after it went through the sieve shaker. We noticed that the 200 gram sample size was too small for the scale we had to use. Most of our samples were coming up as 0 even though there was some sand but it just didn't register because it was less than a gram. So after we went to lunch we decided to double our sample size to see if that would help with the size of the different distributions. We saw that raising the sample size helped us not have the problem of the 0 grams, we still saw a couple but not as many. With the higher sample size we also had a smaller percent error overall which is good. After we finished our second experiment and calculated everything, I graphed the the data using the different sieve sizes, the percentage weight and the cumulative percentage weight of both the 200 gram and 400 gram data sets.
 |
| 200 gram sample data graph |
 |
| 400 gram sample data graph |
There weren't major differences with the 2 data sets but there were some minor changes in the graphs. Something that was constant with both data sets was which sieve had the highest percent weight in both sets, this showed that a major portion of sand in general is around that size, which was 150 microns. After i finished the graph me and my lab partner went around the whole building (inside and out) and used a ASD spectrometer with a fiber optic pistol grip to collect the reflectance of all different types of materials.
 |
| ASD Spectrometer with fiber optic pistol grip in the feild |
Wednesday, July 17, 2019
Day 8

Today we began our day with our morning meeting. Today we were introduced to another interns project. He described what he was doing in his project right now. For example, he is making 3-D (in the program inventor) cars, buildings, etc. to make a scene. After the meeting I went to my lab room and began finishing my coding that I started yesterday. I worked on this for about an hour. After i finished my coding and tested it. Me and my lab partner began going over the GRIT machine. Our
mentor Chris explained to us what it does and how it does it. The GRIT machine is a Goniometer; which is a device that can move around in a 360 azimuth and 0 to 90 degrees in zenith. It measures bidirectional reflectance properties of materials; it measures reflectances using spectrometers. It also shows the ratio of incident vs excitant lighting in all directions (how much light is being absorbed in or reflected out). After going over the GRIT machine we began working on another python code for blob detectors which we are still in the process of finishing.
Tuesday, July 16, 2019
Day 7
This morning we went over the last abstract that we didn't get too yesterday. Then we went to one of the interns labs where he talked about his project that he has been working on. After that I went to my lab. Today me and my lab partner began to run trials with the sieve shaker machine so we could learn how to use it better before
we started our actual project experiments. We used samples of sand and 8 different sieves to run these trials. We used different sizes of the sand sample to compare how the grain size distribution would be affected. When doing these experiments we just used dry sieving because our wet sieving experiment is not set up yet. After doing 2 experiments; one with a sample size of 200 grams and one with a sample size of 997.30 grams we believe that the smaller the sample size the better the values come out and we have a lesser percent error. After we finished our 2 experiments my partner had to leave early, so I began working on some python code to find the mean and standard deviation from columns in a cvs file. I analyzed this image in the program ImageJ:


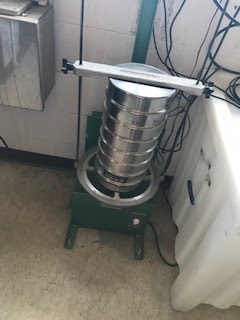 |
| Sieve Shaver Machine |


It ended up looking something like the picture above. If you look closely you can see the yellow lines over each particle of sand. The data from this image then changes into a cvs file which I can upload into python to create a code that will automatically give me the results on the mean and standard deviation of multiple values (ex: mean, min, max and length). Tomorrow I have to finish the code and test it to make sure it works.
Monday, July 15, 2019
Day 6
This morning at our meeting we went over almost all of our abstracts/ problem statements in the past post. We went over them and discussed ways to improve for everyone that was there. After the meeting we went to our labs. In my lab we started our test plan today. We had to compose a outline for our experiments including our material list, procedure, size of sieves, what we needed to make the wet sieving machine, and more. Most of the day I spent working on this. I have to do some research to find our what size tubing we need for the wet sieving machine, finding out that size of tubing will also help find what size nozzle we need for the top of the machine on the lid. During today I also made a data chart to compose our findings on once we start testing. Tomorrow we are gonna finish our test plans.
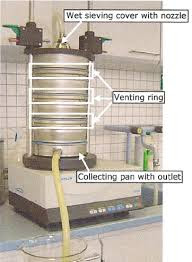


These pictures show the wet sieving experiment and how it is set up.
Sunday, July 14, 2019
Abstract/Problem Statement
Problem
Statement/Abstract:
The
overall goal of my part in this project is to compare wet sieving to,
both manually and automated image analysis techniques, to find the
grain size distribution (GSD) within a given sample. The GSD is
described as the percentage or amount (in weight) of particles in a
given sample of soil, sediment, rock, sand, etc. For my portion of
the project I am focusing on comparing wet sieving methods to image
analysis techniques. Wet sieving is a procedure that is used to
evaluate grain size distribution of a given sample. It is also used
to prepare substances for analysis by removing some fine grains that
could impact the separation process.
When
using image analysis techniques we can compare it manually and
automated. For the manual side of this project we use a software
program called ImageJ, for the automated side we are using the
wavelet method (which is a mathematical function used in digital
signal processing but most relatively used for image compression) and
python coding. When analyzing the different methods we will be
comparing multiple different soil types and compositions to try and
find the best results. The ultimate goal of this project that we are
working on is to find the trafficability of a surface and the
stability and compaction of a surface, using the measurements of
grain size distribution and density found in experiments that we will
be conducting. After experiments are conducted from dry sieving they
will then be compared to see which method of sieving is more accurate
and efficient.
Friday, July 12, 2019
Day 5
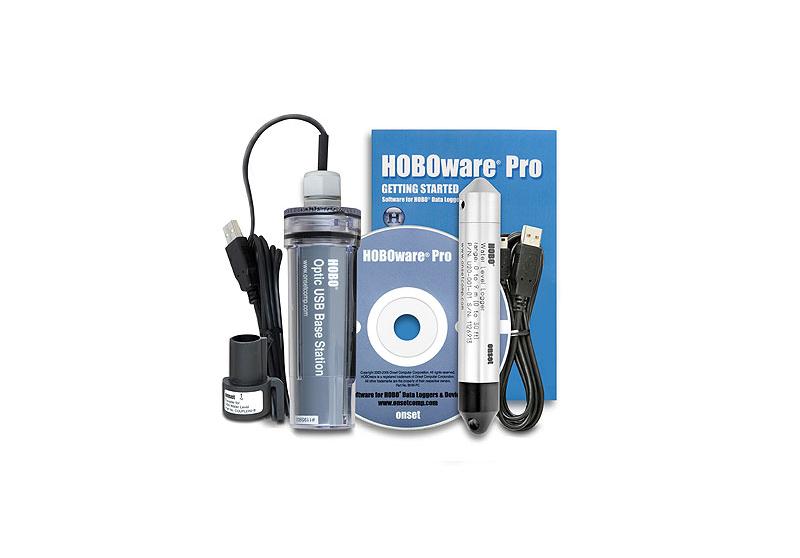
After our meeting this morning, me and my lab partner met in our lab room to go over our problem statements. After finishing them, our mentor Chris came in and we looked at some equipment that came in with the shipments yesterday from Australia. We were instructed to look at the HOBO water level logger and figure out how it works using online resources. We were given a computer that had the HOBO software installed on it. The HOBO water level logger is a water level data logger that continuously measures water level and temperature in a range of different underwater environments (oceans, rivers, streams, ponds, etc.)

After we learned about the HOBO software we left the program running so it would collect data while we were at a seminar at noon. David Messenger talked during this seminar. He introduced Hyperspectral Image Analysis and The Gough Map of Britain. Hyperspectral imaging records and processes information from the electromagnetic spectrum. It looks at each pixel of a image and records the spectrum for each one based on its colors. The Gough Map of Britain is the earliest surviving map that displays the island of Great Britain. The Gough Map is from around the year of 1400, during King Henry IV. After this map was made it was continued to be modified for around 100 years after.


After we learned about the HOBO software we left the program running so it would collect data while we were at a seminar at noon. David Messenger talked during this seminar. He introduced Hyperspectral Image Analysis and The Gough Map of Britain. Hyperspectral imaging records and processes information from the electromagnetic spectrum. It looks at each pixel of a image and records the spectrum for each one based on its colors. The Gough Map of Britain is the earliest surviving map that displays the island of Great Britain. The Gough Map is from around the year of 1400, during King Henry IV. After this map was made it was continued to be modified for around 100 years after.


This map was one of the most geographically accurate maps for that time period and the precision of this map still puzzles scientists to this day. Scientists used Hyperspectral imagery when solving some of the mysteries involving the construction of this map. After this seminar me and my partner went back to our lab and continued to work on the new program that we were given the task of solving how it works. When our mentor came in he looked at our problem statements and helped us improve/ make them better. Once we finished going over those, it was time to go through all the equipment that came back and make sure we got everything back. We printed out the packing list and made sure everything that was sent out, came back. It took us a little bit to go through everything but at the end everything was returned and there were no major problems. Once that was taken care of we talked for a little bit on what the plan was for next week and I honestly can't wait to start!
Thursday, July 11, 2019
Day 4
During our meeting this morning we watched 2 videos on the freshman imaging science class that our advisor Joe Pow teaches. We got to learn a bit about what his class does when school is in session and I found it very interesting by the way that his class takes place. For example, his class does project from day one till imagine RIT towards the end of the year. For example in the images below, this was last years project done by the freshman.


This project was shown at Imagine RIT. They worked with seneca park zoo to create a imaging system that could take images of bugs from all angles for research purposes. This is a very cool way to teach a class, with having no tests, quizzes, no lectures, etc. His teaching stye seems to be very helpful both in the classroom in learning but also out of the classroom with learning to work with others since the first day that you meet that person.
After our meeting I went to my lab room and began finishing my problem statement that was mentioned in the previous blog. At around 9:30am me and my lab partner went to a PhD defense seminar. The speaker was Sanghui Han, and she was teaching about a compact satellite imaging system called CubeSat.

She talked about her milestones in the project and how she came to this research and the results of it. She talked about a spectral image simulation tool DIRSIG. DIRSIG is an abbreviation for the digital imaging and remote sensing image generation model. This model can make single-band, multi-spectral or hyper-spectral imagery from the visible to the infrared region of the electromagnetic spectrum. I found this model to be quite interesting because it gave me another perspective of the world.
After the PhD defense was over I came back to my lab and continued to work on my problem statement that is due on Monday. Right round 3pm equipment came in for my lab that was sent over to Australia for a while for a project that was taking place. We have to unpack and organize that equipment tomorrow.


This project was shown at Imagine RIT. They worked with seneca park zoo to create a imaging system that could take images of bugs from all angles for research purposes. This is a very cool way to teach a class, with having no tests, quizzes, no lectures, etc. His teaching stye seems to be very helpful both in the classroom in learning but also out of the classroom with learning to work with others since the first day that you meet that person.
After our meeting I went to my lab room and began finishing my problem statement that was mentioned in the previous blog. At around 9:30am me and my lab partner went to a PhD defense seminar. The speaker was Sanghui Han, and she was teaching about a compact satellite imaging system called CubeSat.
She talked about her milestones in the project and how she came to this research and the results of it. She talked about a spectral image simulation tool DIRSIG. DIRSIG is an abbreviation for the digital imaging and remote sensing image generation model. This model can make single-band, multi-spectral or hyper-spectral imagery from the visible to the infrared region of the electromagnetic spectrum. I found this model to be quite interesting because it gave me another perspective of the world.
After the PhD defense was over I came back to my lab and continued to work on my problem statement that is due on Monday. Right round 3pm equipment came in for my lab that was sent over to Australia for a while for a project that was taking place. We have to unpack and organize that equipment tomorrow.
Wednesday, July 10, 2019
Day 3
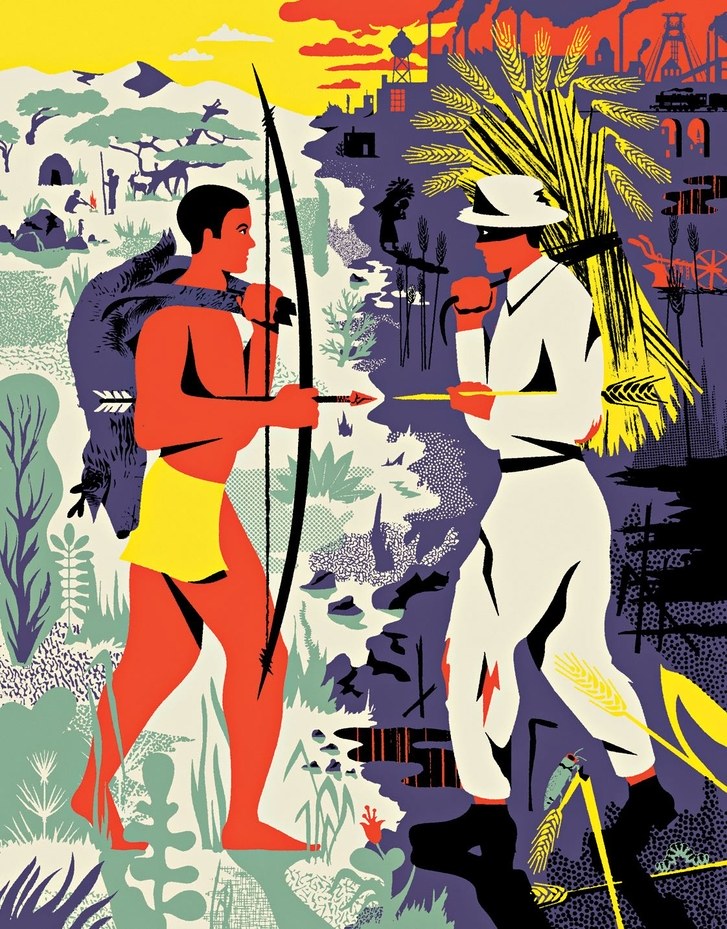
Everyday of the internship will start off with a meeting at 8:45. Today we discussed what we needed to put into our abstracts that are due on Monday. Instead of doing a normal abstract we were instructed to make a problem statement. After the morning meeting we went to our labs and started working on what we needed to for the day. I went to my lab and finished reading the 3 articles I needed to find on the methods of sieving and grain size distribution. After finishing reading the 3 articles at noon a couple of the interns, including myself, went to a seminar where Robert Kremens talked about the history of food production and agriculture. I found the seminar very interesting to hear the history behind food and after that the open topics involving food and how it grew through the years of man. Something I found the most interesting was the change of man being hunters and gathers, to man becoming farmers (as shown in the image below). After the seminar and lunch I came back to my lab and started working on the problem statement that is due Monday. We figured out that the main problem involving this working involves comparing wet sieving methods to image analysis to find the grain size distribution of soil, sand, gravel, clay, etc. The work we are doing is involved in a project that is sponsored by the navy and other government organizations. In some cases areas of ground could be unstable and finding the grain size distribution of land helps people like, for example, soldiers be aware of areas they could sink into. My lab group is going to go over our problem statements on Friday afternoon to do some proof reading.

Tuesday, July 9, 2019
Day 2
Today we started off with with a brief staff meeting a 8:45am going over the calendar for the internship. We got dates for milestones that we need to have done before our big presentation on the last day. After the staff meeting we all went to our lab rooms and met with our advisors to go our our projects and objectives of the day. In my lab we discussed what our project is going to be. We are comparing sieving methods both wet and dry. We are also using image analysis (manual and automated) to find the grain size distribution in soil, rocks, sand, etc. After we went over the project we were given 3 articles to read on grain size distribution (GSD) and different methods used by past authors in finding the GSD. 2 of the articles were on the automative methods, the other article was the various of wet and dry sieving methods. I was given the task to find 3 more articles about the GSD and methods to find it. Today I also started working on finding parts to build a wet sieving set-up online. We needed to find what specific pumps, hoses and connecters we needed to make this set up. We ended finding what size sieves we are going to need but now we to find out what size pumps and their flow rates so it doesn't overflow.


Monday, July 8, 2019
Day 1
Today I started my first day at my summer internship at RIT. I met 6 amazing people today that are my fellow interns. We started off the day with in-processing requirements like; getting our RIT IDs, we set up our computer accounts and went to get parking permits for those who needed them. After we got finished with all of our in-processing requirements, we went back to our meeting room and began to go over all of the rules and details we needed to know for the internship. Once we got done with all of that we started a team building exercise around 11am till 4pm. Everyone split up into groups of 2 and went around the RIT campus for gather pictures or videos of some places or items, and also meet some of the people around the campus. We had to create a video of all the things we found and edit it. We had to have everything done by 4pm and then present it to 3 judges. Everything we found counted towards a certain amount of points based on how we used it in our video. We ended up getting 1077 points out of 2000 and won 3 prizes. After we were finished with that exercise we went and met with our advisors for our lab group and sort of went over what was gonna happen this summer briefly.


Subscribe to:
Posts (Atom)